Reports, Exports and Share
Report Overview
Reports are designed to add value to the information available on screen. Use the print preview option to access the information if a printed copy is not desired.
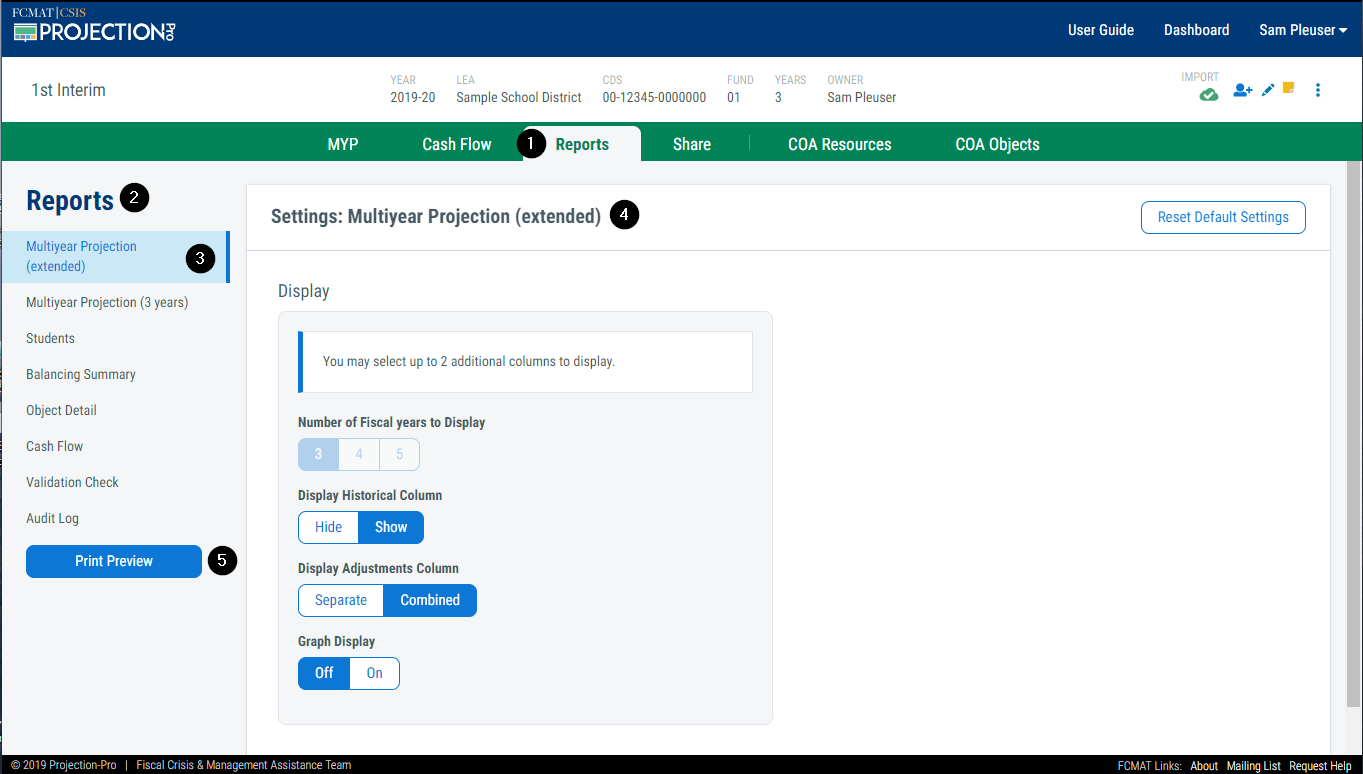
1. Reports Tab
Navigate to the 'Reports' screen by clicking on the tab.
2. Reports Sidebar
The left side contains a sidebar of all available reports.
3. Selection Indicator
The selection indicator highlights the report for which the settings are displayed.
4. Settings
This section shows the settings available for the report.
5. Print Preview
Click this button to preview the report and adjust browser print settings prior to printing.
A. Multiyear Projection (Extended) Report
The 'Multiyear Projection (extended)' report is designed to provide details beyond the standard SACS multiyear projeciton report. The spacing and font size of this report make it easier to read when compared to the 'Multiyear Projection (3 years)' report. Although the report is significantly longer than the 'Multiyear Projection (3 years)' report by default, a locally customized multiyear projection report can be built from the pages of this report by selecting and reordering pages.
Recommendations for a shorter report:
- Remove pages that include expanded detail
- Use select pages to supplement the 'Multiyear Projection (3 years)' report
The report includes the following pages:
- Narrative
- Basic multiyear activity
- Focused salary and benefits multiyear activity
- Components of Ending Fund Balance
- Reserve calculation
- Assumptions
This report prints in landscape. Reports do not automatically display page numbers. Page numbers may be turned on or off within your browser.
Settings
Number of Fiscal Years to Display
Select the number of fiscal years to display.
| Option | Description |
|---|---|
| 3 | Display the base year and year 2 through year 3 |
| 4 | Display the base year and year 2 through year 4 (only available for projections that are four or five years in length) |
| 5 | Display the base year and year 2 through year 5 (only available for projections that are five years in length) |
Display Historical Column
Select whether the historical column is displayed.
| Option | Description |
|---|---|
| Hide | Do not display the historical column in the report |
| Show | Display the historical column in the report |
Display Adjustments Column
Select whether the adjustments column is displayed.
| Option | Description |
|---|---|
| Combined | Displays the adjustments column combined with the base year |
| Separate | Display the adjustments column separate from the base year |
Graph Display
Select whether predefined graphs are displayed. Note: Use the Export feature to create customized graphs
Graphs include:
- Personnel as a percentage of expenditures
- Compare the rate of change for STRS & PERS against total employee benefits
- Net change in fund balance
- Ending fund balance
- Change in available reserves
| Option | Description | Print Length |
|---|---|---|
| Off | Display predefined graphs in the report | 20 pages |
| On | Do not display predefined graphs in the report | 26 pages |
B. Multiyear Projection (3 years) Report
The 'Multiyear Projection (3 years)' report provides a multiyear projection report that closely aligns with the SACS multiyear report. This report can be presented or used as a guide to manually enter the results of your projection in the SACS software. The font size is slightly larger than the SACS multiyear report, and the layout has been designed to make the report easier to read.
The report includes the following pages:
- Basic multiyear activity, including components of ending fund balance and reserve calculation
- Assumptions
If presenting this report, it is recommended to use select pages from the 'Multiyear Projection (extended)' report to supplement this information, such as the narrative pages or other pages that will help communicate the LEA's plans and challenges.
This report prints in portrait. Reports do not automatically display page numbers. Page numbers may be turned on or off within your browser.
Settings
This report has no settings.
C. Students Report
The 'Students' report displays the projected information from the 'Students' screen, including enrollment, unduplicated pupil count and average daily attendance. This report can be used internally to verify the reasonability of projections or shared externally to communicate changes in the student population. The report displays a graph and table to better convey the data.
This report prints in landscape. Reports do not automatically display page numbers. Page numbers may be turned on or off within your browser.
Settings
This report has no settings.
D. Balancing Summary Report
The 'Balancing Summary' report displays summarized resource balancing activity by resource and object group from the 'Contributions and Resource Balancing' screen. This report can be used to summary review an expenditure reduction plan for an LEA nearing fiscal distress. The report is also useful to evaluate which resources receive contributions due to program operating deficits.
This report prints in landscape. Reports do not automatically display page numbers. Page numbers may be turned on or off within your browser.
Settings
Display Resource by Reference
Choose whether to display custom resources by the custom defined code or referenced SACS code.
| Option | Description |
|---|---|
| No | Display custom resources by custom code |
| Yes | Display custom resources by referenced SACS code |
E. Object Detail Report
The 'Object Detail' report is designed primarily as an internal-use report. With flexible settings, it provides detailed resource-object combination and assumption details.
This report prints in landscape. Reports do not automatically display page numbers. Page numbers may be turned on or off within your browser.
Settings
Group by Object or Resource
Choose whether to see the results grouped by object or resource.
| Option | Description |
|---|---|
| Object | Display the results with object headings and resource details |
| Resource | Display the results with resource headings and object details |
Detailed Resource Range
- Enter single or a range of resources to filter the report.
- Enter a range with a hyphen between the start and end resources.
- Separate nonsequential resources with a comma.
Detailed Object Range
- Enter single or a range of objects to filter the report.
- Enter a range with a hyphen between the start and end objects.
- Separate nonsequential objects with a comma.
Display Percentage Assumptions as Dollar or Percent Value
Choose whether to see percentage based assumptions as the percentage or dollar impact.
| Option | Description |
|---|---|
| Dollar | Display rate based assumptions with the resulting dollar impact |
| Percent | Display rate based assumptions with the rate percentage |
Number of Fiscal Years to Display
Select the number of fiscal years to display.
| Option | Description |
|---|---|
| 3 | Display the base year and year 2 through year 3 |
| 4 | Display the base year and year 2 through year 4 (only available for projections that are four or five years in length) |
| 5 | Display the base year and year 2 through year 5 (only available for projections that are five years in length) |
Display Historical Column
Select whether the historical column is displayed.
| Option | Description |
|---|---|
| Hide | Do not display the historical column in the report |
| Show | Display the historical column in the report |
Display Adjustments Column
Select whether the adjustments column is displayed.
| Option | Description |
|---|---|
| Combined | Display the adjustments column combined with the base year |
| Separate | Display the adjustments column separate from the base year |
Display Notes
Select whether notes are displayed.
| Option | Description |
|---|---|
| Hide | Do not display resource-object or assumption notes |
| Show | Display resource-object and assumption notes as annotations with the complete note at the bottom of the report |
Export Overview
Export any resource or resource summary of the multiyear projection into Excel to create customized graphs and charts for presentation.
F. Export a Resource
From a resource screen, click the 'Export' button in the top right corner of the screen. A sample resource screen is resource code 0000.
| Option | Description |
|---|---|
| CSV - Major Object Range | Creates an export with the major categories |
| CSV - Object Detail | Creates an export with the major categories and object detail beneath each category |
G. Export a Resource Summary
From a resource summary screen, click the 'Export' button in the top right corner of the screen. A sample resource summary screen is restricted.
| Option | Description |
|---|---|
| CSV - Major Object Range | Creates an export with the major categories |
| CSV - Object Detail | Creates an export with the major categories and object detail beneath each category |
Share
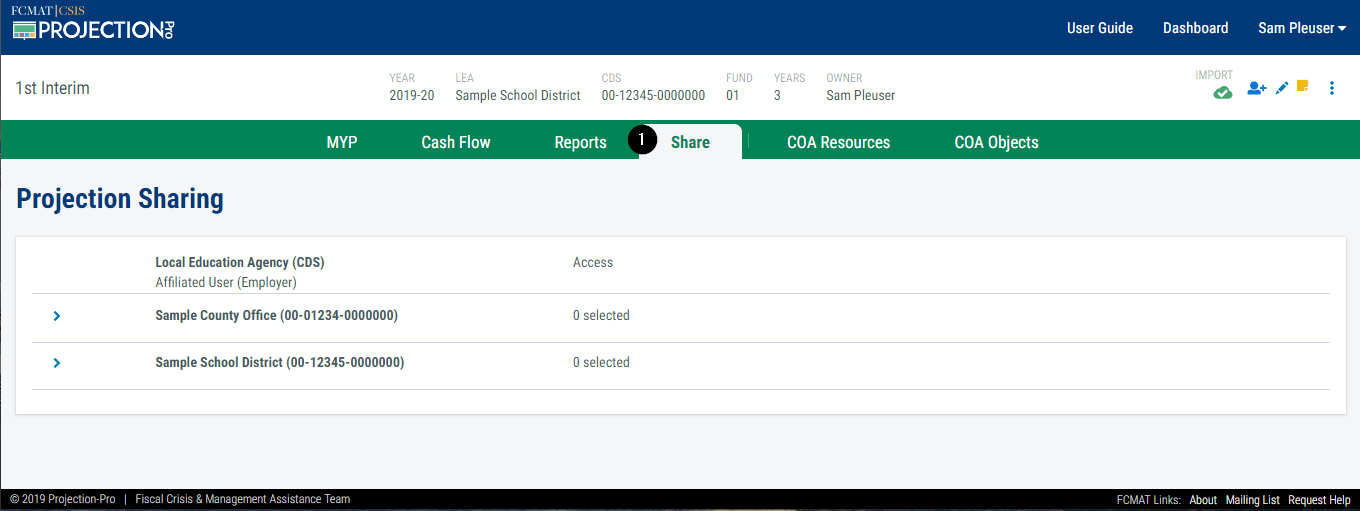
1. Share Tab
Navigate to the 'Share' screen by clicking on the tab.
For more requirements and instructions on how to share a projection, see Share a Projection.