Report, Export and Share
Report Overview
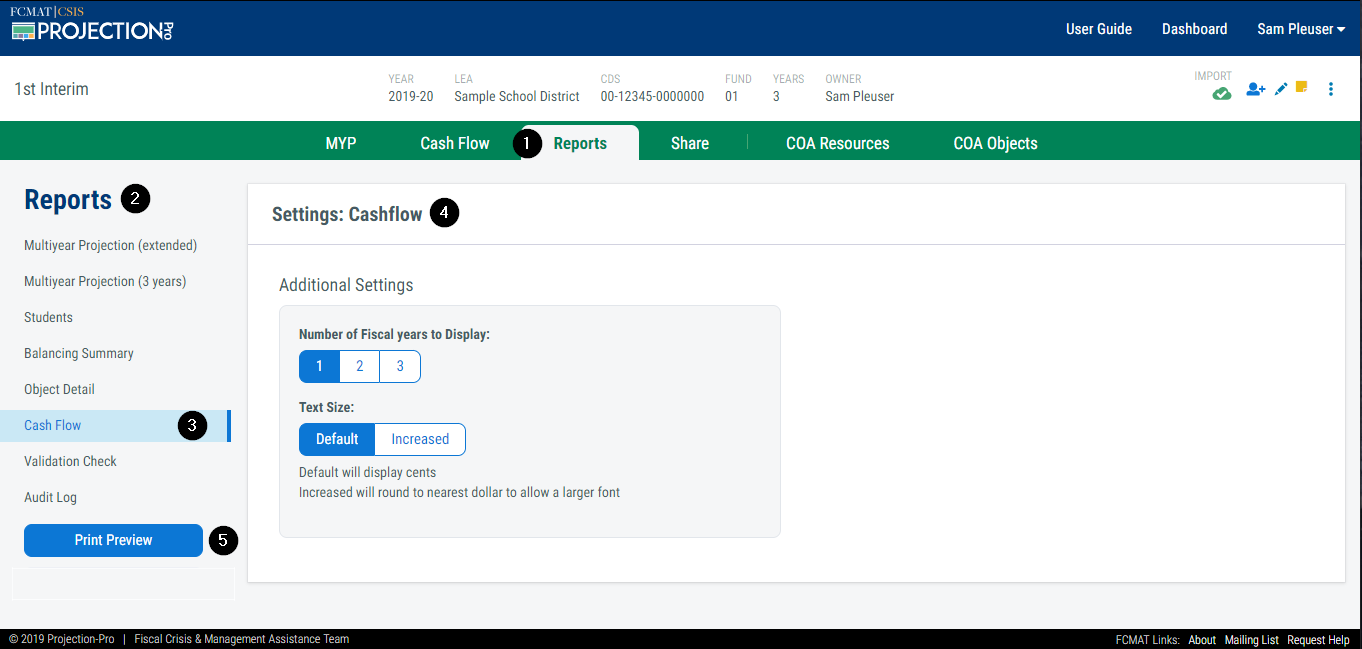
1. Reports Tab
Navigate to the 'Reports' screen by clicking on the tab.
2. Reports Sidebar
The left hand side contains a sidebar of all available reports.
3. Selection Indicator
The selection indicator highlights the report for which the settings are displayed.
4. Settings
This section shows all of the settings available for the report.
5. Print Preview
Click this button to preview the report and adjust browser print settings prior to printing.
A. Cash Flow Report
The 'Cash Flow' report displays monthly activity and cash balance status. Dispalyed categories are modeled after the SACS cash flow report. However, the report is four pages in length per fiscal year to allow additional spacing to make it more readable.
The first two pages focus on the receipts and disbursements sections. The second two pages focus on the balance sheet items. The monthly net increase/decrease and ending cash balances are displayed on all pages.
The first and third pages of each fiscal year displays the months July through February, while the second and fourth pages of each fiscal year displays March through June, accruals, adjustments, total and variance.
This report prints in landscape. Reports do not automatically display page numbers. Page numbers may be turned on or off within your browser.
Settings
Number of Fiscal Years to Display
Select the number of fiscal years to display.
| Option | Description | Print Length |
|---|---|---|
| 1 | Display only the base year | 4 pages |
| 2 | Display the base year and year 2 | 8 pages |
| 3 | Display the base year and years 2 through 3 | 12 pages |
| 4 | Display the base year and years 2 through 4 (only available for projections that are 4 or 5 years in length) | 16 pages |
| 5 | Display the base year and years 2 through 5 (only available for projections that are 5 years in length) | 20 pages |
Text Size
Select the desired text size for the printed report.
| Option | Description |
|---|---|
| Default | Standard font size (7 point size) |
| Increased | Increases the font size by rounding display values to nearest whole dollar. (8 point size) |
 
Export Overview
Export any single year of the cash flow projection into Excel to create customized graphs and charts for presentation.
B. Cash Flow Export
Select the projected fiscal year from the display toggle and click the 'Export' link to the right of the toggle.
| Option | Description |
|---|---|
| None | There are no options for this export. |
Share
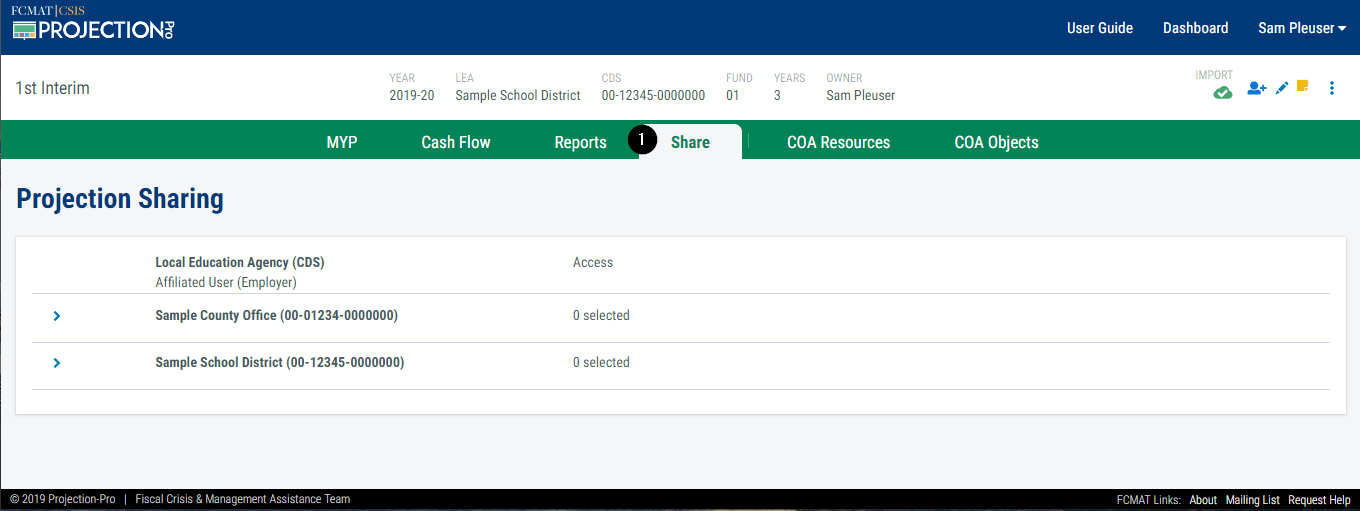
1. Share Tab
Navigate to the 'Share' screen by clicking on the tab.
For more requirements and instructions on how to share a projection, see [/GettingStarted/Dashboard/#share-a-projection].