Cash Flow Projection Overview
A cash flow projection is a mathematical model that projects the annual budget and beginning balances activity on a monthly basis. Because the projection estimates cash inflows and outflows on a monthly basis, a cash flow projection is a key tool in assessing an LEA's short term viability. In contrast, a multiyear projection is a key tool in assessing an LEA's ongoing sustainability.
The base year is comprised of actual cash flow activity and projected activity. Other future years contain only projected activity. Because of this difference, the projection schedules are independently set for each fiscal year.
Heading
The heading is visible throughout the projection, after login. It contains three main sections.
1. System Menu
The system menu bar is available at the top of the screen. On the right, it contains links to this User Guide, the Dashboard and the name menu. The name menu contains links to:
- 'My Profile'
- 'LEA Data' (if you are setup as an LEA administrator)
- a 'Full Screen' display option
- 'Request Help'
- 'Log Out' of the software
2. Projection Highlights
The projection highlights bar is available directly below the main menu bar at the top of the screen. It contains basic information for the projection being worked in, including the title, base year, LEA, CDS code, fund, projection length and projection owner.
On the right side, the projection highlights bar includes icons (from left to right):
- an import icon that allows import or reimport of the base year without returning to the dashboard
- a non-functional share icon that indicates the share status of the projection
- an edit pencil icon that allows changes to be made to the title and projection length without returning to the dashboard
- a menu button that allows a projection to be copied or removed without returning to the dashboard
3. Projection Menu
The projection menu is a series of tabs that allows navigation between major elements of the projection:
- 'MYP'
Navigates to the multiyear projection screen and defaults to the resource view. - 'Cash Flow'
Navigates to the cash flow screen. Selection of this tab will prompt to create a cash flow if one has not previously been created. - 'Reports'
Navigates to the Reports screen to view and print multiyear and cash flow reports - 'Share'
Navigates to the Projection Sharing screen to grant recipients access - 'COA Resources' and 'COA Objects'
Navigates to the 'Chart of Accounts' screens. Allows codes resource and object codes to be setup in a single projection.
Workspace
Cash flow does not have multiple screens like the multiyear projection. Instead, a single screen is used to display one fiscal year at a time.
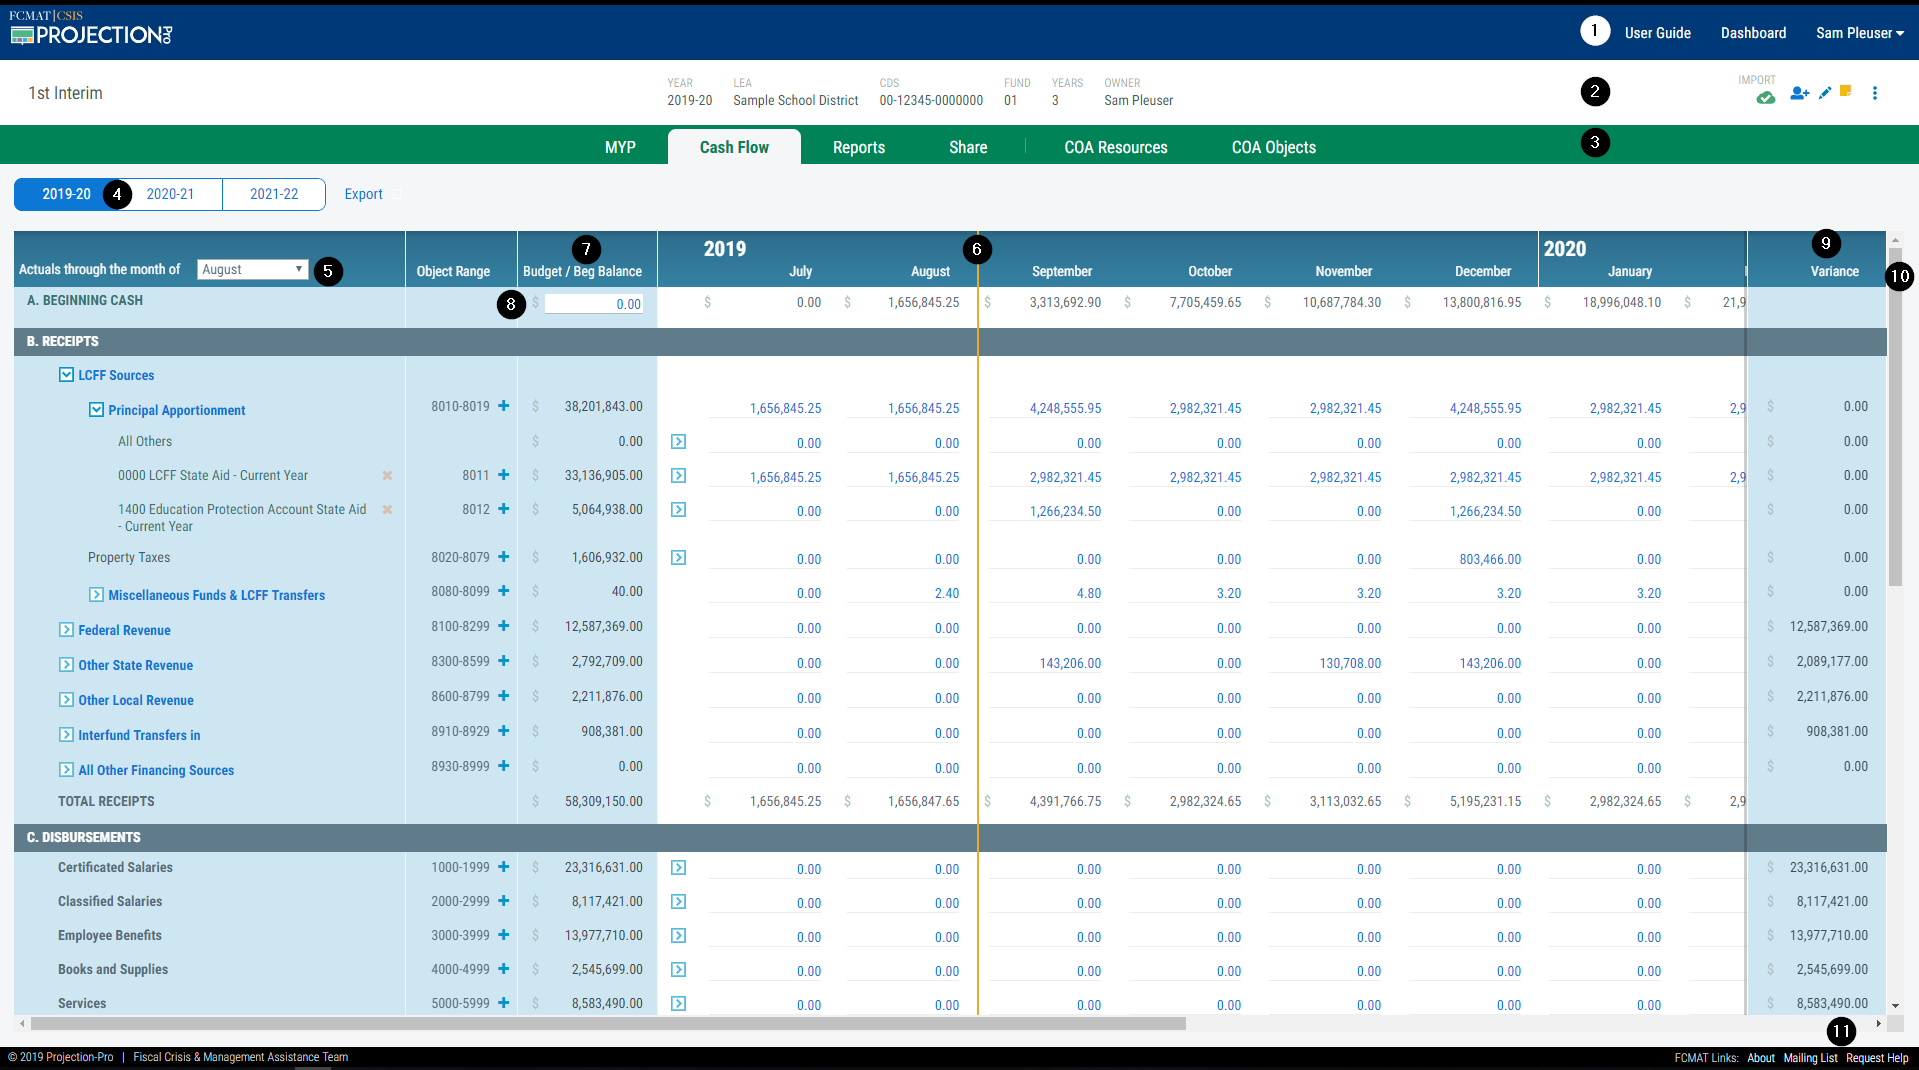
4. Fiscal Year Toggle
Use this toggle to display the cash flow projection for the given fiscal year.
The number of fiscal years displayed is driven by the 'Total Projection Years' displayed on the 'Dashboard' for the projection. A three-year projection will offer three years to create a cash flow. A five-year projection will offer five years to create a cash flow.
A cash flow projection is not required for every multiyear projected, although it is useful in some cases. As a best practice, a minimum 18-month cash flow projection is recommended. The length should be increased for LEAs nearing or in fiscal distress.
5. 'Actuals Through The Month Of' Entry Box
In the base year only, select the month that represents the actual cash activities from the dropdown field. For initial budget adoption prior to July 1, leave this field blank to indicate actuals are excluded from the projection.
This field is referenced in the refresh projection schedule process.
6. 'Actuals Through The Month Of' Indicator Line
In the base year only, an orange indicator line divides display of actual and projected values based on the month selected in the 'Actuals Through The Month Of' field.
This indicator line also identifies the starting point for the refresh projection schedule process.
7. Budget / Beg Balance Column
This column displays the budget or beginning balance for each category or detail.
For 'Receipts' and 'Disbursements', the budget balance from the multiyear projection is automatically displayed.
Enter the beginning balance for each projected fiscal year for the 'Balance Sheet Items' section. The base year values should align with the finanical system. Future projected years should align with the ending balances and accrual activity from the prior year.
8. Beginning Cash
In the base year only, enter the beginning cash balance from the financial system in this box. Future years are automatically filled with the ending cash balance projected from the prior fiscal year.
9. Variance Column
The 'Variance' column is used to determine if budgeted activity for a fiscal year has been projected by month within the cash flow. The 'Variance' column is calculated as the difference between the 'Budget / Beg Balance' and 'Total' columns.
For example, if an LEA projects a budget of $100,000 and $100,000 of activity is projected to occur in September with no other activity projected in other months, then the 'Variance' column will display $0, confirming that the entire budget's activity has been projected.
If a budget is underprojected, the variance column will show a positive value. For example, if an LEA projects a budget of $100,000 and $85,000 of activity is projected to occur in September with no other activity projected in other months, then the 'Variance' column will display $15,000.
If a budget is overprojected, the variance column will show a negative value. For example, if an LEA projects a budget of $100,000 and $120,000 of activity is projected to occur in September with no other activity projected in other months, then the 'Variance' column will display ($20,000).
10. Scroll Bars
The system uses vertical and horizontal scroll bars to view off-screen sections of the workspace. Screens with multiple sections, like Designations, have scroll bars specific to each section. Use the browser scrollbars in conjunction with the section scrollbars to navigate projection details.
Footer
The footer is visible throughout the projection, after login.
11. FCMAT Links
'FCMAT Links' are provided in the software as a convenience. The pages are also accessible directly at the FCMAT website.
- 'About' links to background information about FCMAT on the FCMAT webpage.
- 'Mailing List' links to the subscribe/unsubscribe page for the Projection-Pro 'Pro-Announce' email list.
- 'Request Help' links to the FCMAT help desk.