Students
This screen is designed to assist LEAs in developing student count estimates based on industry best practice projection methods. The results of the screen are used to determine the reserve rate and drives a special 'Student' assumption.
The screen has been designed to be flexible, allowing LEAs that develop estimates outside of the system to enter the results on this screen.
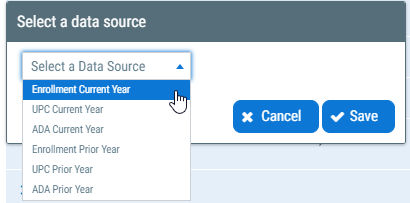
Data Sources
Student projection calculations are based on historical information.
System Defaults
FCMAT maintains historical student data based on publicly available information from the California Department of Education (CDE). Following is a list of data displayed on the 'Students' screen and original source documents.
School District
- Enrollment by School
- Principal Apportionment exhibits
- School District ADA
- School District Unduplicated Pupil Percentage
Charter School
- Enrollment by School
- Principal Apportionment exhibits
- Charter School ADA
- Charter School Unduplicated Pupil Percentage
County Office
- Principal Apportionment exhibits
- County Operations Grant
- County LCFF Calculation
- County Unduplicated Pupil Percentage
LEA Data
The LEA Admin can update the system default student counts in the 'LEA Data' 'Students' screen. The 'LEA Data' counts automatically flow into new projections.
Projection
Enrollment, unduplicated pupil count (UPC) and average daily attendance (ADA) can be modified within an individual projection to create alternative scenarios.
Once a projection is created, the student information is held constant unless manually updated. This permits the projection to be retained as a snapshot in time even if the LEA/system student information is updated in the future. The revert icon or 'Revert All' button can be used to align an existing projection's data to 'LEA Data.'
Sections
The screen contains three sections for every LEA:
- Enrollment
- Unduplicated Pupil Count (UPC)
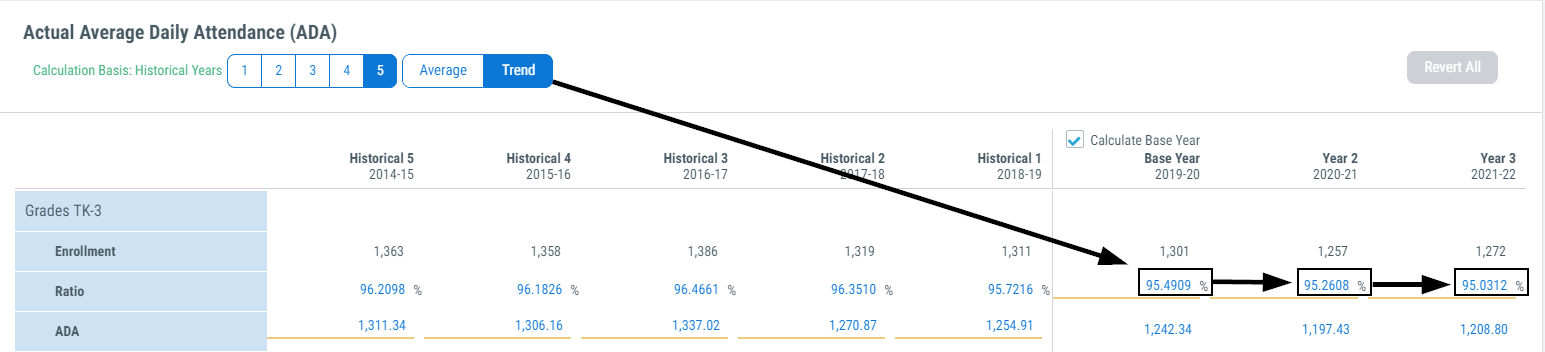
- Actual Average Daily Attendance (ADA)
Although the screens are customized for the different LEA types - school district, charter school and county office the functionality on the screen is similar. Following are sample screens to help explain the functionality:
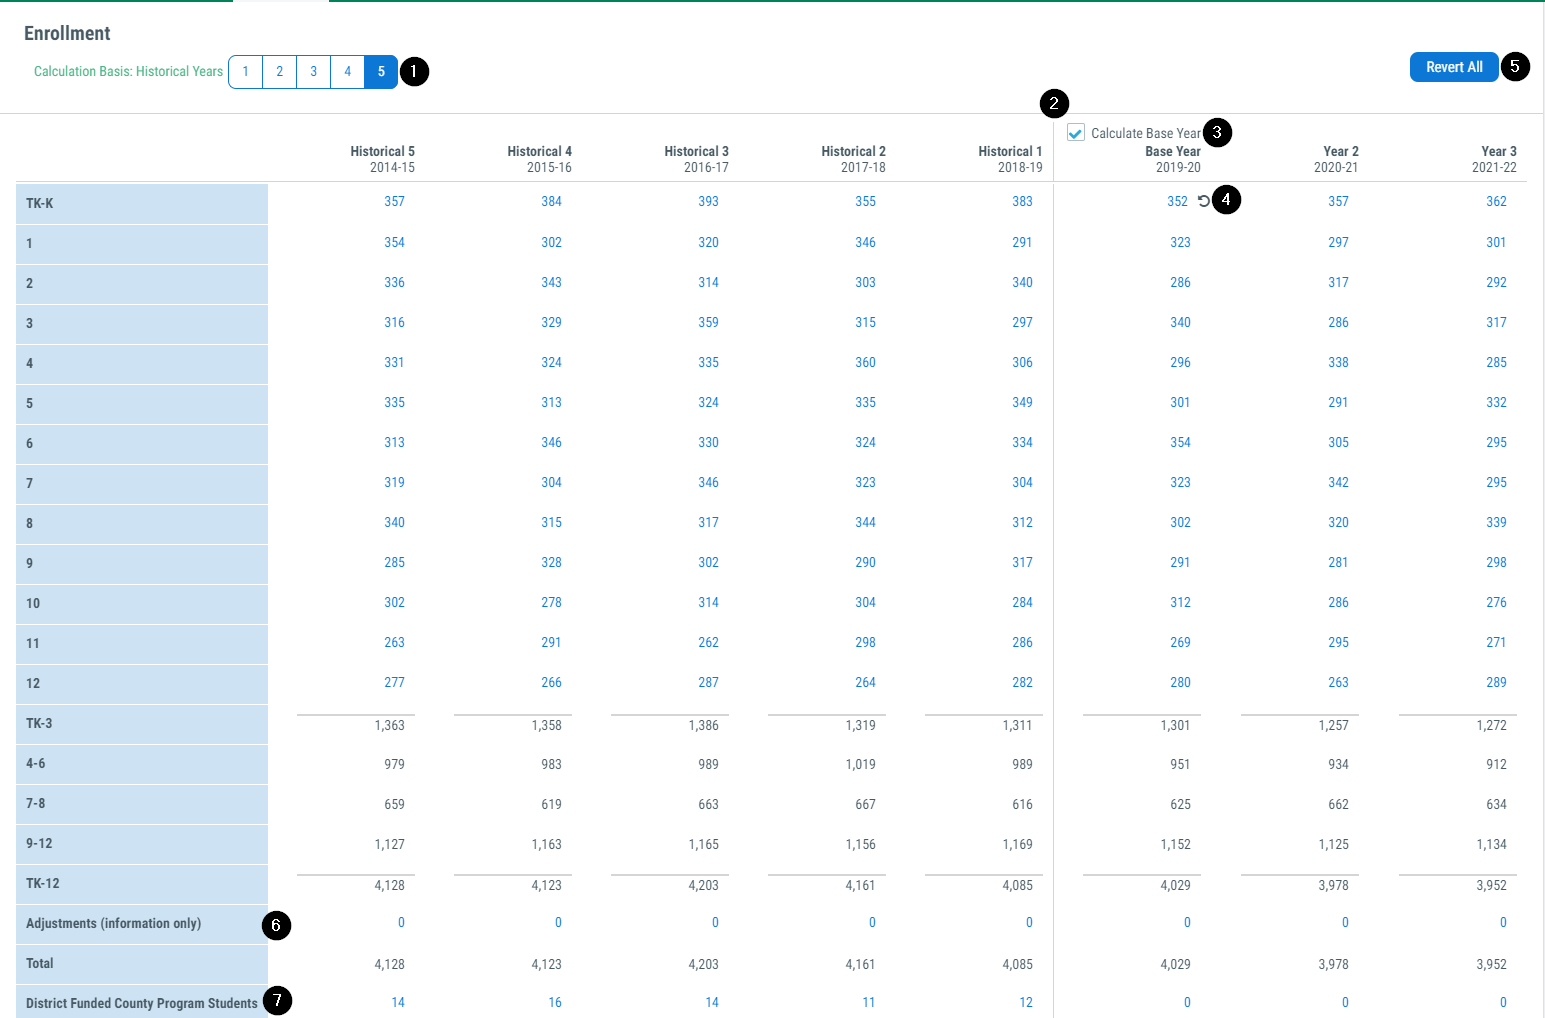
1. Number of Historical Years
This toggle determines the number of historical years to use as the basis for projecting the future years. Five historical years is default.
2. Projection Line
This line separates the historical data from the projected data. It adjusts when the 'Calculate Base Year' checkbox is selected or deselected.
3. Calculate Base Year
By default, the projection will calculate the base year's values for each section. To include the base year values as part of the historical years, uncheck this box and enter the known student data values.
For example, Information Day is the first Wednesday in October. Enrollment and unduplicated pupil count snapshots are taken as of Information Day. Once this data has been calculated and reasonably verified, uncheck the 'Calculate Base Year' button to use the actual data when projecting other future years.
When the base year is part of the historical years, 'Historical 5' is removed from the calculation.
4. Revert Icon
Use this icon to revert a single data point back to the value entered on 'LEA Data' for historical years or calculated by the system for projected years. The icon will only display when a value has been manually entered in the projection or LEA Data has been updated.
5. Revert All Button
Use this button to revert the entire section back to the data entered on 'LEA Data' for historical years or calculated by the system for projected years. The button will only be enabled when a value in the section has been manually entered in the projection or LEA Data has been updated.
6. Adjustments Line
This line is informational only and does not appear or affect any other areas of the projection or reports. Use of this line is up to local discretion, but it is provided to demonstrate balancing certifications that include student populations that would otherwise be excluded from the listed data.
7. County Students
Use this line to project school district-district funded county program students or charter school-county funded charter program students. Due to the nature of these students, the system does not project this line. Enter local projections manually.
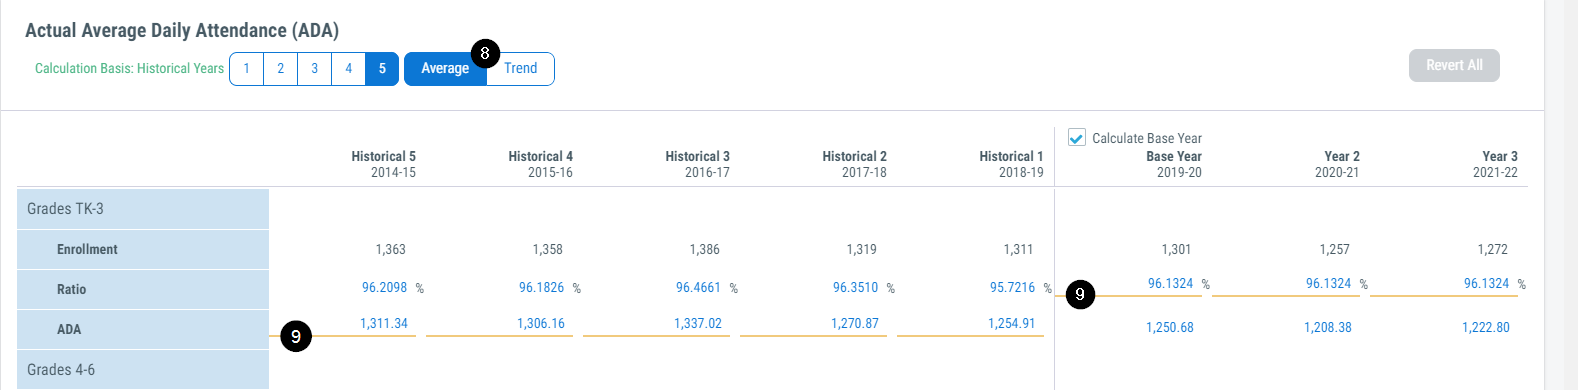
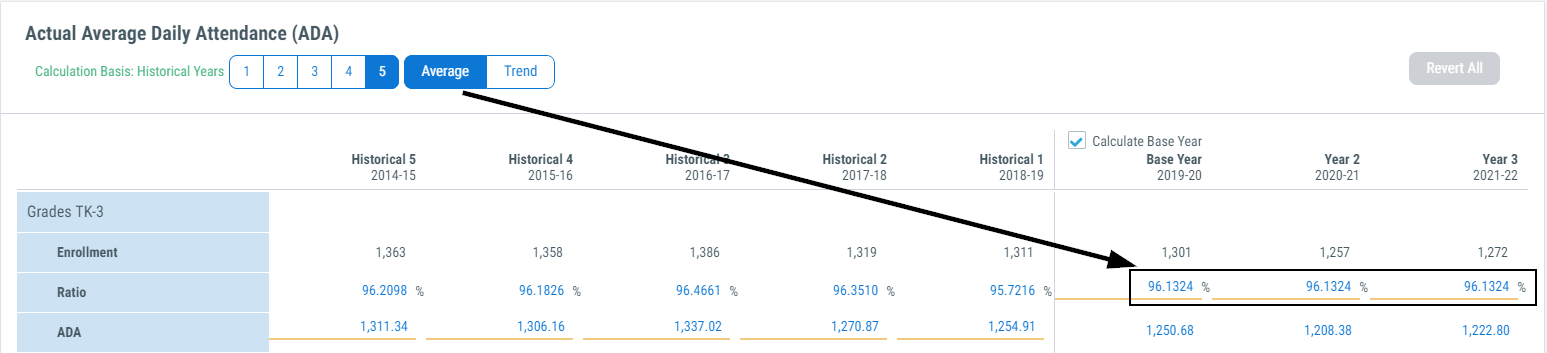
8. Average and Trend Toggle
Select either the 'Average' or 'Trend' toggle based on the projection scenario that best fits the LEA. The 'Students' report contains graphs to help determine which method may be more appropriate for the LEA.
Average
If the LEA historically demonstrates a stable relationship between ADA or UPC to enrollment and is projected to continue having a stable relationship, use the 'Average' method. The system will calculate a single weighted average ratio to project future years.
Trend
If the LEA historically demonstrates an increase or decrease in the relationship between ADA or UPC to enrollment and is projected to continue that trend, use the 'Trend' method. The system will calculate a series of weighted average ratios to project the trend in future years.
9. Indicator Bar
This orange line indicates which of the two values, the ratio of UPC or ADA to enrollment or the UPC or ADA count, is used to calculate the other value.
In historical years, the certified UPC and ADA data is used to calculate the ratio to enrollment. Therefore, the indicator bar highlights the 'UPC' or 'ADA' because it is used to calculate the 'Ratio.'
In projected years, the ratio to enrollment is used to calculate the UPC or ADA. Therefore the indicator bar highlights the 'Ratio' because it is used to calculate the 'UPC' or 'ADA.'
As the UPC and ADA projections are customized, the indicator bar will update to highlight the value being used to calculate the alternate value. For example, if an LEA produces an ADA projection outside of the software and enters the resulting ADA in the software, the indicator line will highlight 'ADA' becuase it will be used to calculate the displayed 'Ratio' values.
Detailed Calculations
All calculations on the 'Students' screen are weighted to give more recent history greater emphasis in the projection. For more detailed calculations, please request additional assistance through the FCMAT help desk.
Because there isn't a cohort to draw from, the initial grade served in a school district or charter school and most county office enrollment categories are calculated based on the average change between years within the grade or category.
School district and charter school enrollment projections for grades other than the initial grade served are based on the cohort survival method between grades.
Unduplicated pupil count and average daily attendance are based on the historical relationship to enrollment and conveyed as a ratio.
Students Assumption
By default, the 'Students' assumption is not applied in the projection. Local LEAs should determine how they wish to use their student data to project revenues and expenditures. For example, if an LEA projects student growth, it should apply the 'Students' assumption to both revenues and expenditures, not just revenue. Similarly, if an LEA projects student decline, it should apply the 'Students' assumption to both expenditures and revenues, not just expenditures.
The 'Students' assumption has options to select:
- current or prior year counts - for use when projecting revenue that is based on prior year counts
- enrollment, UPC or ADA